This function creates a static map of occurrence records using ggplot2, highlighting which points were flagged by data-validation functions. This visualization helps users quickly inspect spatial patterns of flagged and unflagged records and diagnose potential data-quality issues.
The function can also be used to plot the heatmap generated by the
spatial_kde() function.
Usage
ggmap_here(
  occ,
  species = NULL,
  long = "decimalLongitude",
  lat = "decimalLatitude",
  flags = "all",
  additional_flags = NULL,
  names_additional_flags = NULL,
  col_additional_flags = NULL,
  show_no_flagged = TRUE,
  col_points = NULL,
  size_points = 1,
  heatmap = NULL,
  low_color = "blue",
  mid_color = "yellow",
  high_color = "red",
  midpoint = 0.5,
  alpha_heatmap = 0.5,
  continent = NULL,
  continent_fill = "gray70",
  continent_linewidth = 0.3,
  continent_border = "white",
  ocean_fill = "aliceblue",
  extension = NULL,
  facet_wrap = FALSE,
  theme_plot = ggplot2::theme_minimal(),
  ...
)
Arguments
- occ
(data.frame or data.table) a dataset containing occurrence records that has been processed by one or more flagging functions. See Details for available flag types.
- species
(character) name of the species to subset and plot. Default is
NULL, meaning that all records for all species are plotted.- long
(character) the name of the column in
occthat contains the longitude values. Default is"decimalLongitude".- lat
(character) the name of the column in
occthat contains the latitude values. Default is"decimalLatitude".- flags
(character) the flags to be used for coloring the records. Use
"all"to display all available flags. See Details for all options. Default is"all".- additional_flags
(character) an optional named character vector with the names of additional logical columns to be used as flags. Default is
NULL.- names_additional_flags
(character) an optional different name to the flag provided in
additional_flagsto be shown in the map. Only applicable ifadditional_flagsis not NULL.- col_additional_flags
(character) if
additional_flagsis provided, the color of the records flagged in this column. Obligatory ifadditional_flagsis not NULL.- show_no_flagged
(logical) whether to display records that did not receive any flag.Default is TRUE.
- col_points
(character) A named vector assigning colors to each flag. If
NULL, default colors from the internal objectRuHere::flag_colors()are used.- size_points
(numeric) point size for plotting occurrences. Default is 6.
- heatmap
(SpatRaster) an optional heatmap containing the estimated density of occurrence records, typically generated by the
spatial_kde()function. Default is NULL.- low_color
(character) color used for the lowest density values in the heatmap. Only applicable if a heatmap is provided. Default is "blue".
- mid_color
(character) color used for the midpoint of the heatmap gradient. Default is "yellow".
- high_color
(character) color used for the highest density values in the heatmap. Default is "red".
- midpoint
(numeric) the central value of the heatmap gradient, corresponding to
mid_color. Default is 0.5.- alpha_heatmap
(numeric) Alpha transparency applied to the heatmap layer, ranging from 0 (fully transparent) to 1 (fully opaque). Default is 0.5.
- continent
(SpatVector) optional polygon layer representing continent boundaries. If
NULL, a built-in simplified world map is used (see Details). Default:NULL.- continent_fill
(character) fill color for the continent polygons. Default is "gray70".
- continent_linewidth
(numeric) line width for continent boundaries. Default is 0.3.
- continent_border
(character) color of the continent polygon borders. Default is "white".
- ocean_fill
(character) background color used to represent the ocean. Default is "aliceblue".
- extension
(SpatExtent or numeric) optional map extent specified as a
SpatExtentor as a numeric vector of length 4 in the order:xmin, xmax, ymin, ymax. Default isNULL(computed automatically from the extent of the occurrence data).- facet_wrap
(logical) whether to plots each flag in a separate panel using
ggplot2::facet_wrap(). Default isFALSE.- theme_plot
(theme) a
ggplot2theme object. Default isggplot2::theme_minimal().- ...
other arguments passed to
ggplot2::theme().
Details
This function expects an occurrence dataset that has already been processed
by one or more flagging routines from RuHere or related packages such as
CoordinateCleaner. Any logical column in occ can be used as a flag.
The following built-in flag names are recognized:
From RuHere:
correct_country, correct_state, cultivated, florabr, faunabr,
wcvp, iucn, bien, duplicated, thin_geo, thin_env, consensus
From CoordinateCleaner:
.val, .equ, .zer, .cap, .cen, .sea, .urb, .otl, .gbf,
.inst, .aohi
Users may also supply additional logical columns using
additional_flags, optionally providing alternative display names
(names_additional_flags) and colors (col_additional_flags).
If continent is not provided, the background map is a simplified world
polygon included with the package (a modified version of
rnaturalearthdata::map_units110). To inspect this object, run:
terra::unwrap(getExportedValue("RuHere", "world"))When facet_wrap = TRUE, each flag is plotted in a separate panel,
allowing direct comparison among different types of data issues.
Examples
# Load example data
data("occ_flagged", package = "RuHere")
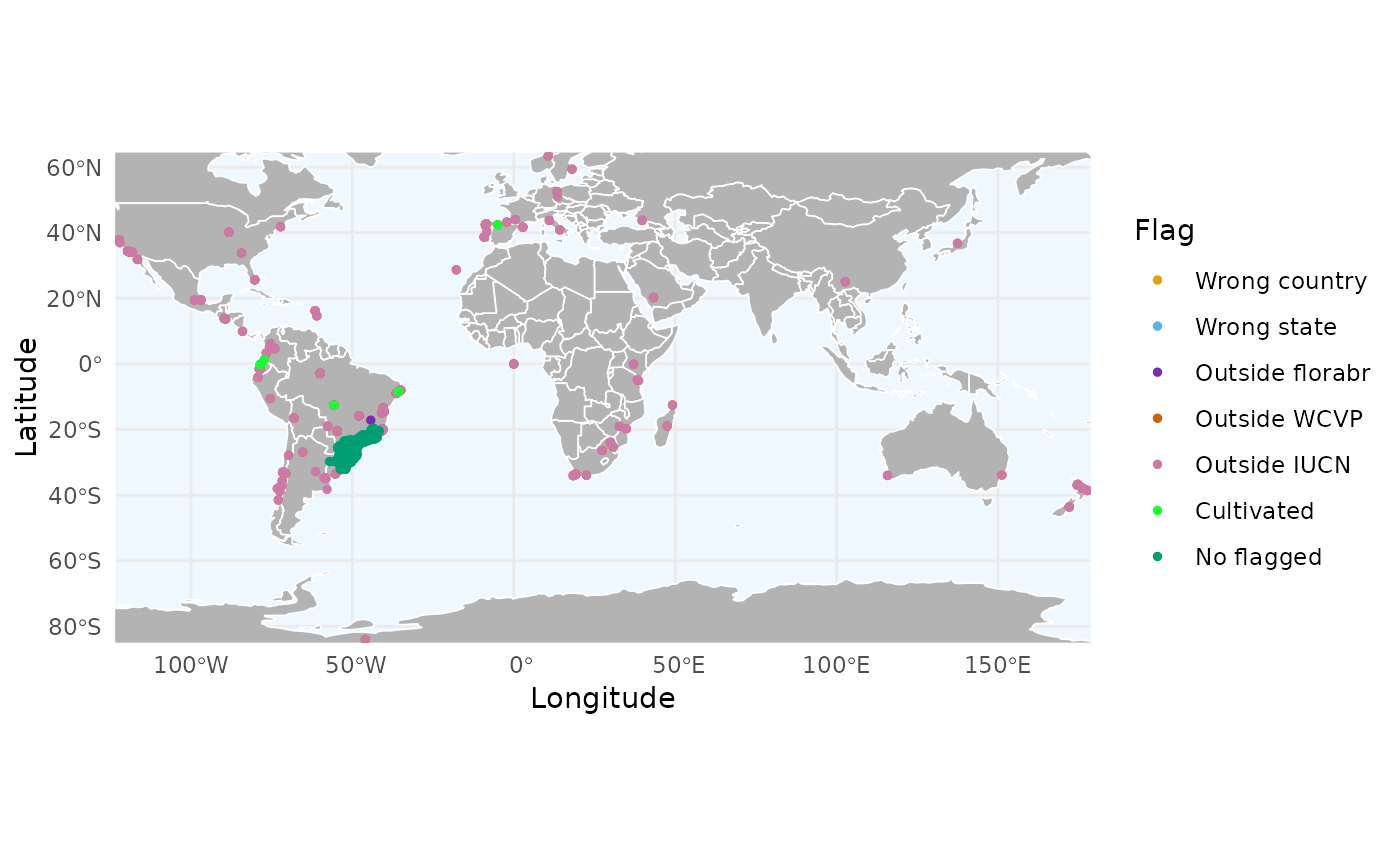
# Visualize all flags with ggplot
ggmap_here(occ = occ_flagged)
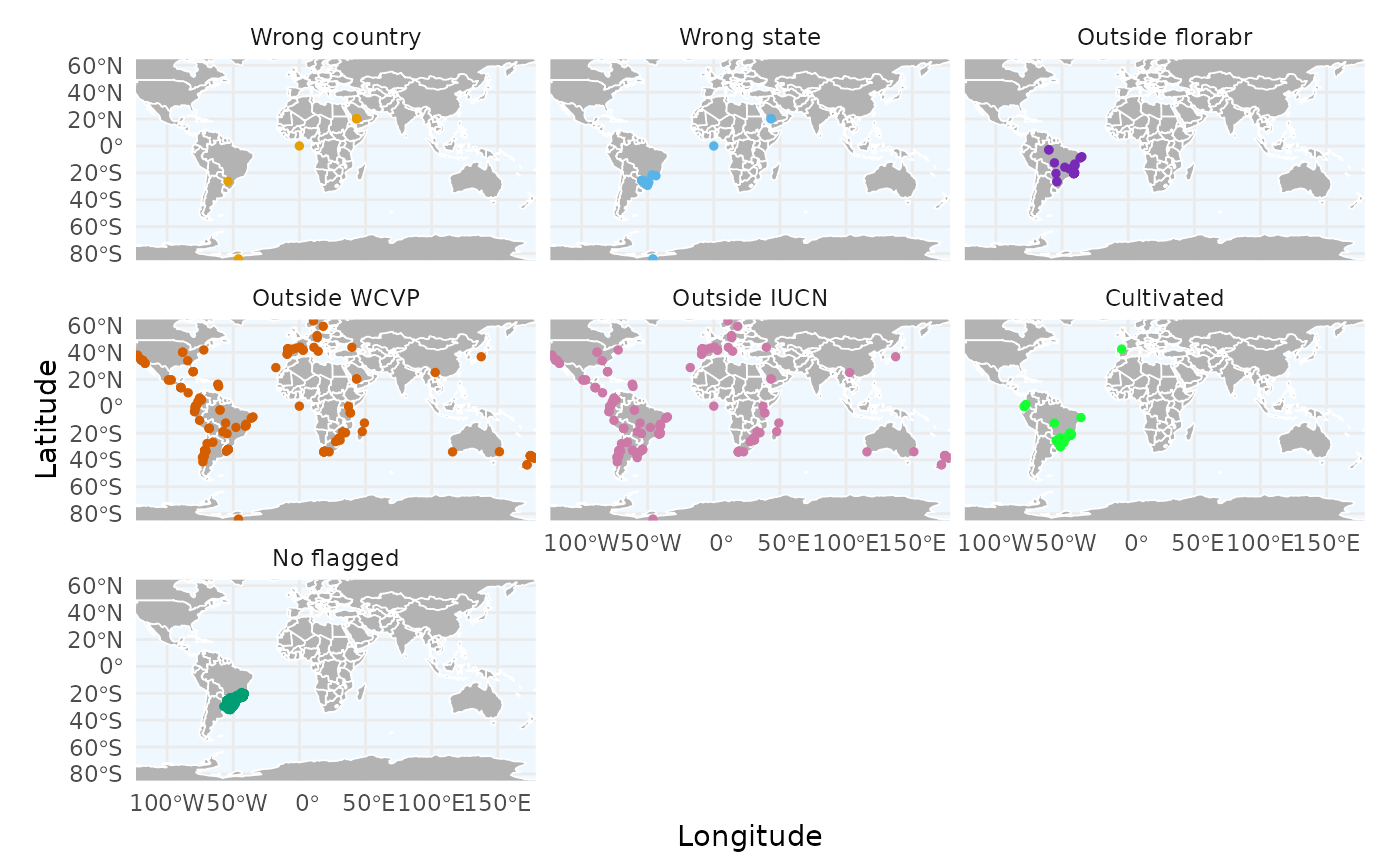
 # Visualize each flag in a separate panel
ggmap_here(occ = occ_flagged, facet_wrap = TRUE)
# Visualize each flag in a separate panel
ggmap_here(occ = occ_flagged, facet_wrap = TRUE)